

Question: Using 2000 as the base period, compute a simple index of domestic sales for each year from 2004 until 2015. Interpret the trend in domestic
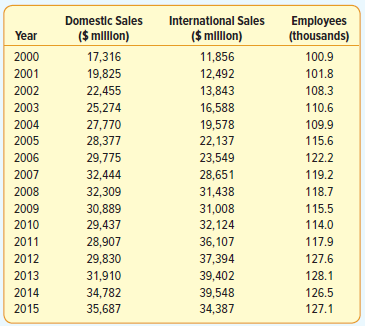
Domestic Sales Internatlonal Sales Employees (thousands) ($ mllon) ($ mllon) Year 17,316 2000 11,856 100.9 2001 19,825 12,492 101.8 2002 22,455 13,843 108.3 110.6 2003 25,274 16,588 27,770 28,377 2004 19,578 109.9 2005 22,137 115.6 122.2 2006 29,775 23,549 28,651 2007 32,444 119.2 2008 32,309 31,438 118.7 31,008 2009 30,889 115.5 29,437 2010 32,124 114.0 2011 117.9 28,907 36,107 2012 29,830 37,394 127.6 39,402 2013 31,910 128.1 2014 34,782 39,548 126.5 2015 35,687 34,387 127.1
Step by Step Solution
3.39 Rating (168 Votes )
There are 3 Steps involved in it
Domestic sales increased by about 26 by 2008 then declined ... View full answer

Get step-by-step solutions from verified subject matter experts
Document Format (2 attachments)
1511_605d88e139a7b_675649.pdf
180 KBs PDF File
1511_605d88e139a7b_675649.docx
120 KBs Word File