

Refer to the Baseball 2018 data, which report information on the 30 Major League Baseball teams for
Question:
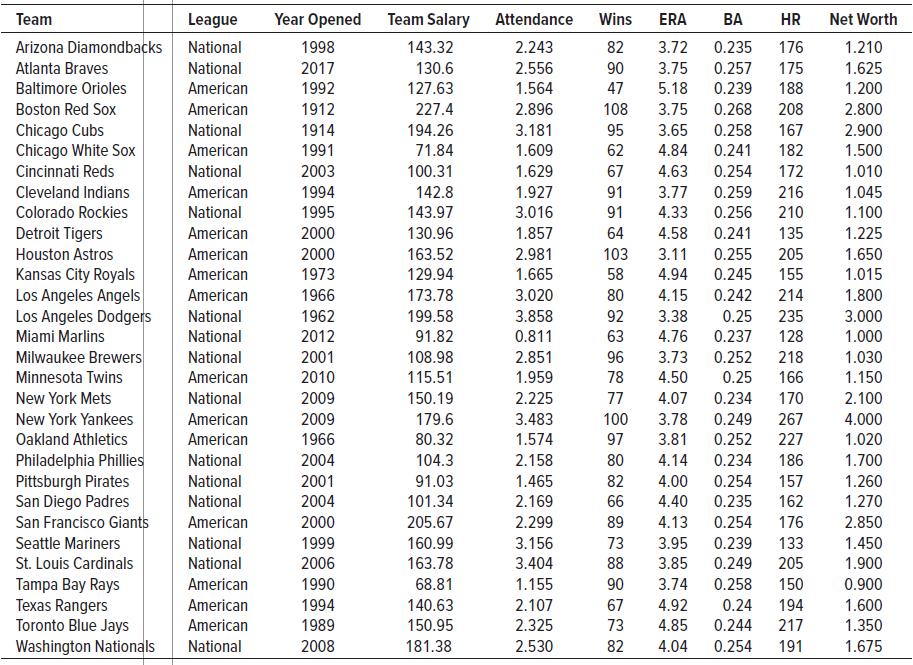
Refer to the Baseball 2018 data, which report information on the 30 Major League Baseball teams for the 2018 season. Over the last decade, the mean attendance per team followed a normal distribution with a mean of 2.45 million per team and a standard deviation of .71 million. Compute the mean attendance per team for the 2018 season. Determine the likelihood of a sample mean attendance this large or larger from the population.
Data From Baseball 2018:
Fantastic news! We've Found the answer you've been seeking!
Step by Step Answer:
Mean 2018 attendance is 2322 ...View the full answer

Answered By
Utsab mitra
I have the expertise to deliver these subjects to college and higher-level students. The services would involve only solving assignments, homework help, and others.
I have experience in delivering these subjects for the last 6 years on a freelancing basis in different companies around the globe. I am CMA certified and CGMA UK. I have professional experience of 18 years in the industry involved in the manufacturing company and IT implementation experience of over 12 years.
I have delivered this help to students effortlessly, which is essential to give the students a good grade in their studies.
2+ Reviews
10+ Question Solved
Related Book For 

Statistical Techniques In Business And Economics
ISBN: 9781260239478
18th Edition
Authors: Douglas Lind, William Marchal, Samuel Wathen
Question Posted:
