

Refer to the data in Exercise 41. First compute a new variable by subtracting points scored
Question:
Refer to the data in Exercise 41. First compute a new variable by subtracting “points scored” – “points allowed.” Call this new variable “point differential.” For the following questions, “wins” will be the dependent variable and “point differential” will be the independent variable. Note that during the National Football League season, each team plays 16 games.
a. Create a scatterplot of “wins” versus “point differential.” What do you observe?
b. Calculate the correlation coefficient for “wins” and “point differential”. Interpret the result.
c. Complete a regression analysis of the relationship. Report and interpret the coefficient of determination.
d. Write the regression equation that predicts “wins.”
e. What is the “point differential” that corresponds with a team that wins 8 games (and loses 8 games)? Interpret this finding.
f. Using the slope of the regression line, in a season, what is the increase in the point differential that corresponds to an increase of one win?
Data From Exercise 41:
For each of the 32 National Football League teams, the numbers of points scored and allowed during the 2018 season are shown here:
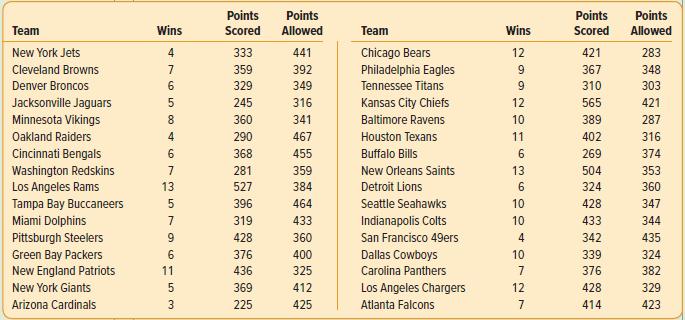
Assuming these are sample data, answer the following questions. You may use statistical software to assist you.
Step by Step Answer:
a There is a positive relationship between wins and point differential Also all teams with a losing ...View the full answer


Statistical Techniques In Business And Economics
ISBN: 9781260239478
18th Edition
Authors: Douglas Lind, William Marchal, Samuel Wathen
