

Refer to the Lincolnville School District bus data. Select the variable referring to the number of miles
Question:
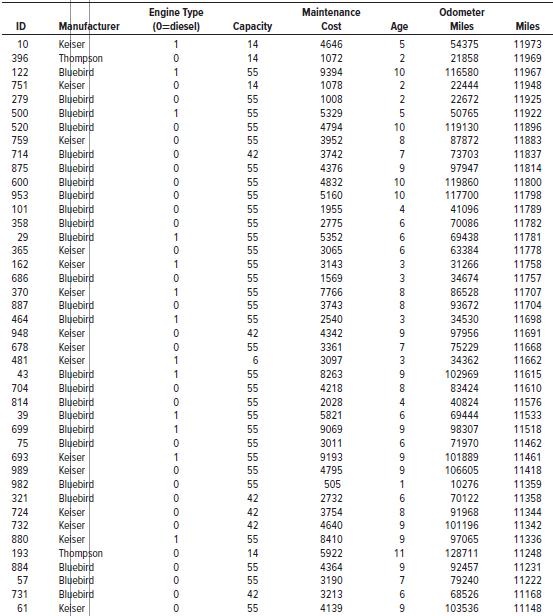
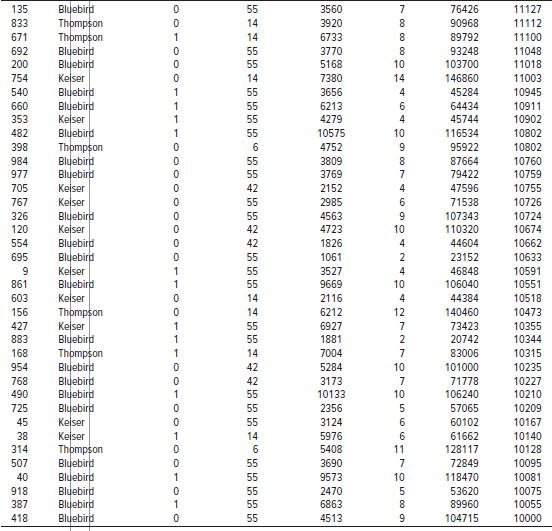
Refer to the Lincolnville School District bus data. Select the variable referring to the number of miles traveled since the last maintenance, and then organize these data into a frequency distribution.
a. What is a typical amount of miles traveled? What is the range?
b. Comment on the shape of the distribution. Are there any outliers in terms of miles driven?
c. Draw a cumulative relative frequency distribution. Forty percent of the buses were driven fewer than how many miles? How many buses were driven less than 10,500 miles?
d. Refer to the variables regarding the bus manufacturer and the bus capacity. Draw a pie chart of each variable and write a description of your results.
Data From Lincolnville School District bus data:
Step by Step Answer:
Since 2 6 64 80 128 2 7 use 7 classes The interval should be at least 11973100007 281 miles Use 300 ...View the full answer


Statistical Techniques In Business And Economics
ISBN: 9781260239478
18th Edition
Authors: Douglas Lind, William Marchal, Samuel Wathen
