Question:
Refer to the North Valley Real Estate data, which report information on homes sold during the last year. For the variable price, select an appropriate class interval and organize the selling prices into a frequency distribution. Write a brief report summarizing your findings. Be sure to answer the following questions in your report.
a. Around what values of price do the data tend to cluster?
b. Based on the frequency distribution, what is the typical selling price in the first class? What is the typical selling price in the last class?
c. Draw a cumulative relative frequency distribution. Using this distribution, 50% of the homes sold for what price or less? Estimate the lower price of the top 10% of homes sold. About what percent of the homes sold for less than $300,000?
d. Refer to the variable bedrooms. Draw a bar chart showing the number of homes sold with two, three, four, or more bedrooms. Write a description of the distribution.
Data From North Valley Real Estate Data:
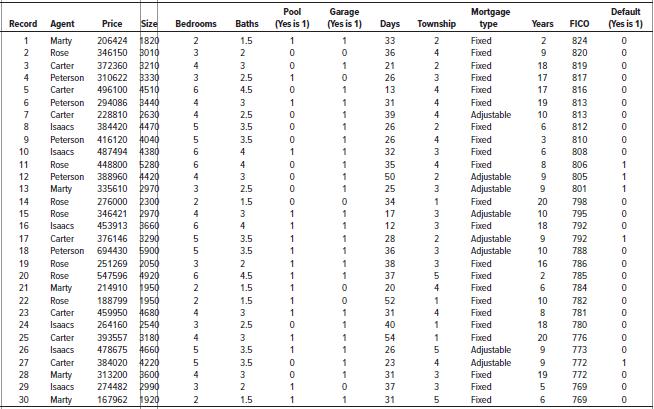
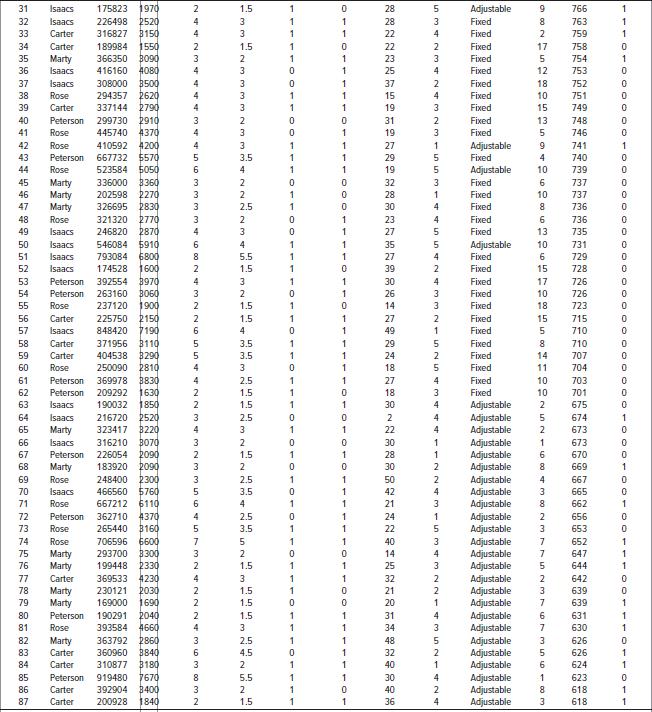
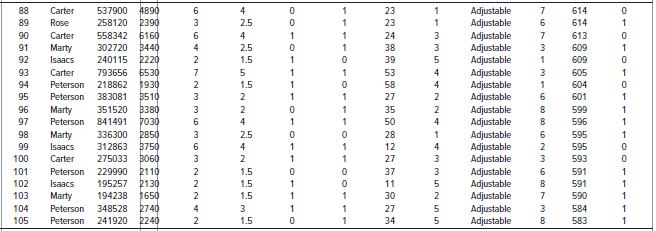
Transcribed Image Text:
1970 2520 3150 1550 366350 B090 4080 3500 294357 2620 337144 2790 299730 2910 445740 4370 4200 $570 5050 3360 202598 2270 2830 2770 246820 2870 $910 793084 6800 1600 Peterson 392554 3970 263160 BO60 1900 2150 848420 7190 371956 3110 8290 2810 3830 1630 1850 2520 3220 B070 226054 2090 2090 2300 466560 $760 667212 6110 4370 160 6600 3300 2330 4230 2030 1690 2040 4660 2860 8840 B180 919480 7670 392904 3400 1840 31 Isaacs 175823 2 1.5 1 28 5 Adjustable 766 32 Isaacs 226498 4 3 1 28 Fixed 763 1 33 Carter 316827 4 22 4 Fixed 759 34 Carter 189984 2 1.5 1 22 Fixed 17 758 35 Marty Isaacs 3 2 1 23 Fixed 754 1 36 416160 4 3 25 Fixed 12 753 37 Isaacs 308000 3 1 37 2 Fixed 18 752 38 Rose 4 3 15 Fixed 10 751 39 Carter 3 1 1 19 Fixed 15 749 40 Peterson 2 31 2 Fixed 13 748 41 Rose 4 3 19 Fixed 746 Adjustable Fixed Adjustable 42 Rose 410592 4 27 741 43 Peterson 667732 3.5 1 1 29 4 740 44 Rose 523584 6. 19 10 739 45 Marty Marty Marty 336000 2 32 3 Fixed 6 737 46 3 2 1 28 Fixed 10 737 47 326695 3 2.5 1. 30 Fixed 8. 736 48 Rose 321320 3 2 1 23 Fixed 6. 736 49 Isaacs 4 1 27 Fixed 13 735 50 Isaacs 546084 4 1 1 35 Adjustable Fixed 10 731 51 Isaacs 8 5.5 1 27 4 6. 729 52 Isaacs 174528 2 1.5 39 2 Fixed 15 728 53 3 1 1 30 4 Fixed 17 726 54 Peterson 3 2 26 3 Fixed 10 726 55 Rose 237120 2 1.5 1 14 3 Fixed 18 723 56 Carter 225750 2 1.5 1 27 2 Fixed Fixed 15 715 57 Isaacs 4 49 1 710 58 Carter 3.5 1 1 29 Fixed 710 59 Carter 404538 3.5 1 1 24 2 Fixed 14 707 60 Rose 250090 4 3 18 Fixed 11 704 61 Peterson 369978 4 2.5 1 1 27 Fixed 10 703 62 Peterson 209292 2 1.5 1 0. 18 3 Fixed 10 701 63 Isaacs 190032 2 1.5 1 30 Adjustable Adjustable Adjustable Adjustable Adjustable Adjustable Adjustable Adjustable Adjustable Adjustable Adjustable Adjustable Adjustable Adjustable Adjustable Adjustable Adjustable Adjustable Adjustable Adjustable Adjustable Adjustable Adjustable Adjustable Adjustable 2 675 64 Isaacs 216720 3 2.5 2 4 674 1 65 Marty 323417 4 3 1 22 2 673 66 Isaacs 316210 2 30 1 673 67 Peterson 2 1.5 1 28 1 670 68 Marty Rose 183920 2 30 2 8. 669 1 69 248400 2.5 1 50 2 667 70 Isaacs 3.5 1 42 4 3 665 71 Rose 6 4 1 1 21 3 8. 662 1 72 Peterson 362710 4 2.5 24 1 2 656 73 Rose 265440 3.5 1 22 5 653 74 Rose 706596 5 1 40 652 1 75 Marty Marty 293700 3 2 14 4 7 647 76 199448 2 1.5 1 25 644 1 77 Carter Marty Marty 369533 4 3 1 1 32 2 642 78 230121 2 1.5 1 21 2 639 79 169000 2 1.5 20 639 1 80 Peterson 190291 2 1.5 1 1 31 4 631 1 81 Rose 393584 3 1 34 3 7 630 1 82 363792 Marty Carter 3 2.5 1 48 626 83 360960 4.5 1 32 2 626 1 84 Carter 310877 3 2 40 6. 624 1 85 Peterson 5.5 1 30 4 623 618 618 Carter 1 1 86 3 2 1 40 2 8. 87 Carter 200928 2 1.5 1 36 4 un un un


