

The table shows the total annual sales of U.S. gasoline in millions of dollars from 2006 to
Question:
The table shows the total annual sales of U.S. gasoline in millions of dollars from 2006 to 2017. (On the site https://www.census.gov/retail/index.html#mrts, find “Monthly Retail Trade Report,” then select “Time Series/Trend Charts” to find the data for total U.S. sales of gasoline.)
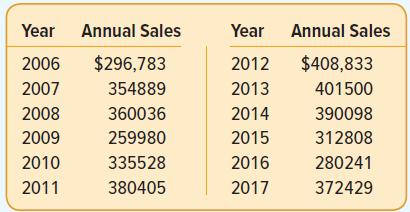
a. G raph the data.
b. Based on the graph, describe the time series pattern.
c. For this time series, why is forecasting with a trend model appropriate?
d. E valuate a trend forecasting model using simple linear regression. What is the MAD?
e. What is the predicted annual change of industry sales?
f. Using the trend model, forecast the next 3 years of gasoline sales.
Fantastic news! We've Found the answer you've been seeking!
Step by Step Answer:
a b The graph suggests a positive time series trend in gasoline sales ...View the full answer

Answered By
GERALD KAMAU
non-plagiarism work, timely work and A++ work
6+ Reviews
11+ Question Solved
Related Book For 

Statistical Techniques In Business And Economics
ISBN: 9781260239478
18th Edition
Authors: Douglas Lind, William Marchal, Samuel Wathen
Question Posted:
