

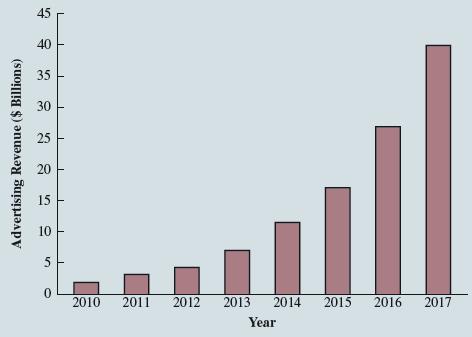
Figure 1.8 provides a bar chart showing the annual advertising revenue for Facebook from 2010 to 2017
Question:
Figure 1.8 provides a bar chart showing the annual advertising revenue for Facebook from 2010 to 2017 (Facebook Annual Reports).
a. What is the variable of interest?
b. Are the data categorical or quantitative?
c. Are the data time series or cross-sectional?
d. Comment on the trend in Facebook’s annual advertising revenue over time
Fantastic news! We've Found the answer you've been seeking!
Step by Step Answer:
a Facebook worldwide advertis...View the full answer

Answered By
Muhammad Mahtab
everyone looks that their work be perfect. I have more than a five year experience as a lecture in reputable institution, national and international. I provide perfect solution in marketing, case study, finance problems, blog writing, article writing, business plans, strategic management, human resource, operation management, power point presentation and lot of clients need. Here is right mentor who help clients in their multi-disciplinary needs.
3+ Reviews
14+ Question Solved
Related Book For 
Statistics For Business & Economics
ISBN: 9781337901062
14th Edition
Authors: David R. Anderson, Dennis J. Sweeney, Thomas A. Williams, Jeffrey D. Camm, James J. Cochran
Question Posted:
