

Question: C11. Using the output from GSS 2018 data that is presented below, describe the association between marital status and a respondents preferred candidate in the
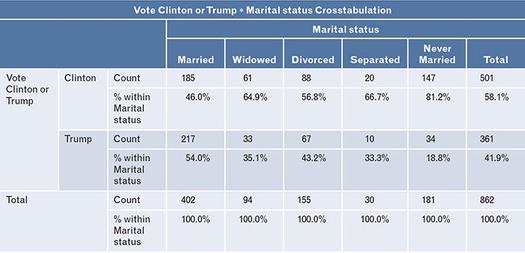
C11. Using the output from GSS 2018 data that is presented below, describe the association between marital status and a respondent’s preferred candidate in the 2016 U.S. presidential election. While we present multiple measures of associations, you should only report and describe the appropriate measure of association.
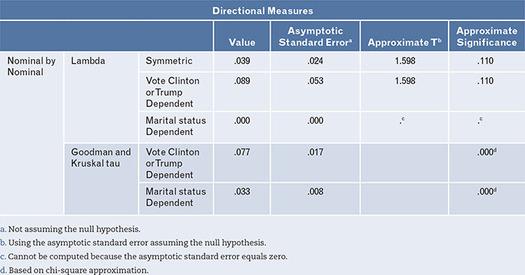
a. Not assuming the null hypothesis.
b. Using the asymptotic standard error assuming the null hypothesis.
c. Cannot be computed because the asymptotic standard error equals zero.
d. Based on chi-square approximation
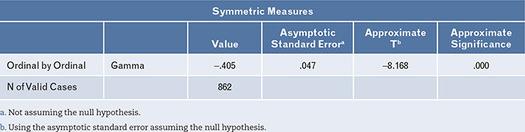
a. Not assuming the null hypothesis.
b. Using the asymptotic standard error assuming the null hypothesis.
Vote Clinton or Trump Vote Clinton or Trump Marital status Crosstabulation Marital status Never Married Widowed Divorced Separated Married Total Clinton Count 185 61 88 20 147 501 % within 46.0% 64.9% 56.8% 66.7% 81.2% 58.1% Marital status Trump Count 217 33 67 10 34 361 % within 54.0% 35.1% 43.2% 33.3% 18.8% 41.9% Marital status Total Count % within Marital status 402 94 155 30 181 862 100.0% 100.0% 100.0% 100.0% 100.0% 100.0%
Step by Step Solution
There are 3 Steps involved in it

Get step-by-step solutions from verified subject matter experts