

Question: C2. In this exercise, we will investigate the relationships between adolescent fertility rate and female labor force participation in South America. Data are presented for
C2. In this exercise, we will investigate the relationships between adolescent fertility rate and female labor force participation in South America. Data are presented for 2014.
1. Construct a scatterplot for adolescent fertility rate and labor force participation rate.
Do you think the scatterplot can be characterized by a linear relationship?
2. Calculate the coefficient of determination and correlation coefficient.
3. Describe the relationship between the variables based on your calculations.
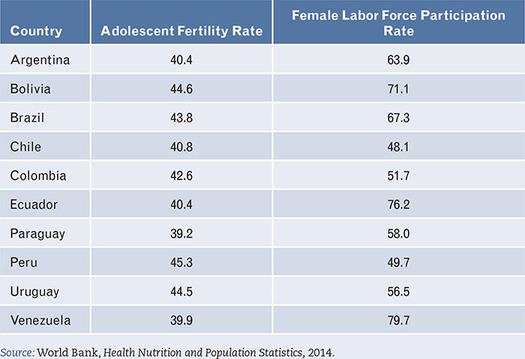
Female Labor Force Participation Country Argentina Adolescent Fertility Rate Rate 40.4 63.9 Bolivia 44.6 71.1 Brazil 43.8 67.3 Chile 40.8 48.1 Colombia 42.6 51.7 Ecuador 40.4 76.2 Paraguay 39.2 58.0 Peru 45.3 49.7 Uruguay 44.5 56.5 Venezuela 39.9 79.7 Source: World Bank, Health Nutrition and Population Statistics, 2014.
Step by Step Solution
There are 3 Steps involved in it

Get step-by-step solutions from verified subject matter experts