

Question: SPS S output from the GSS 2018 is presented here, reporting respondents ideal number of children. Description Ideal Number of Children 1. Which category contains
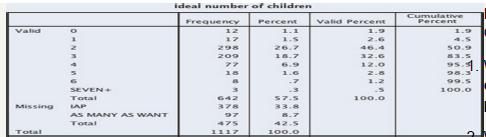
SPS S output from the GSS 2018 is presented here, reporting respondents’ ideal number of children.
Description
Ideal Number of Children 1. Which category contains the 90th percentile?
2. What is the median?
3. What is the mean? Calculate based only on the valid responses.
4. Given your findings, is the distribution symmetrical, positively skewed, or negatively skewed?
ideal number of children Frequency Percent Valid Percent Valid 12 1.1 1.9 17 1.5 2.6 298 26.7 46.4 209 18.7 32.6 77 6.9 12.0 18 1.6 2.8 -7 1.2 SEVEN+ 3 Total 642 57.5 100.0 Missing LAP 378 33.8 AS MANY AS WANT 97 8.7 Total 475 42.5 Total 1117 100.0 Cumulative Percen 1.9 4.5 50.9 83.5 98.3 99.5 100.0
Step by Step Solution
There are 3 Steps involved in it

Get step-by-step solutions from verified subject matter experts