

Question: Table 13 (reproduced from Table 4 of Larson, Dworkin, & Verma, 2001) shows ratings of various aspects of work and home life of 100 middle-class
Table 13 (reproduced from Table 4 of Larson, Dworkin, & Verma, 2001) shows ratings of various aspects of work and home life of 100 middle-class men in India who were fathers. Pick three rows of interest to you and explain the results to someone who is familiar with the mean, variance, and Z scores but knows nothing else about statistics.
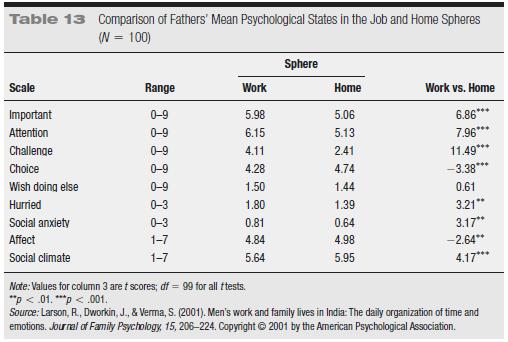
Table 13 Comparison of Fathers' Mean Psychological States in the Job and Home Spheres (N = 100) Sphere Scale Range Work Home Work vs. Home Important 0-9 5.98 5.06 6.86" Attention 0-9 6.15 5.13 7.96*** Challenge 0-9 4.11 2.41 11.49*** Choice 0-9 4.28 4.74 -3.38*** Wish doing else 0-9 1.50 1.44 0.61 Hurried 0-3 1.80 1.39 3.21" Social anxiety 0-3 0.81 0.64 3.17** Affect 1-7 4.84 4.98 -2.64** Social climate 1-7 5.64 5.95 4.17*** Note: Values for column 3 are t scores; df = 99 for all t tests. **p < .01. ***p < .001. Source: Larson, R., Dworkin, J., & Verma, S. (2001). Men's work and family lives in India: The daily organization of time and emotions. Journal of Family Psychology, 15, 206-224. Copyright 2001 by the American Psychological Association.
Step by Step Solution
There are 3 Steps involved in it

Get step-by-step solutions from verified subject matter experts