

Question: Weve calculated the mean and standard deviation scores for each group in Table 11.2. Compute each mean (Chapter 3) and standard deviation (Chapter 4) and
We’ve calculated the mean and standard deviation scores for each group in Table 11.2. Compute each mean (Chapter 3) and standard deviation (Chapter 4) and confirm that our statistics are correct.
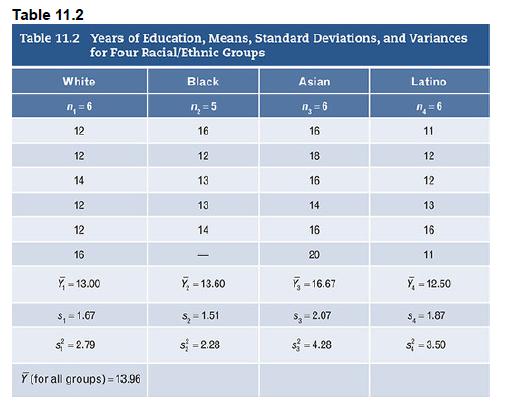
Table 11.2 Table 11.2 Years of Education, Means, Standard Deviations, and Variances for Four Racial/Ethnic Groups White Black Asian Latino n = 6 = 5 n = 6 n =6 12 16 16 11 12 12 18 12 14 13 16 12 12 13 14 13 12 14 16 16 16 20 11 -13.00 -13.60 -16.67 -12.50 $,- 1.67 S=1.51 -2.07 5-1.87 s = 2.79 S =2.28 4.28 s=3.50 Y (for all groups) = 13.96
Step by Step Solution
There are 3 Steps involved in it
1 Expert Approved Answer
Step: 1 Unlock

Question Has Been Solved by an Expert!
Get step-by-step solutions from verified subject matter experts
Step: 2 Unlock
Step: 3 Unlock