

Question: Yeast population Shown is the graph of the population function Pstd for yeast cells in a laboratory culture. Use the method of Example 1 to
Yeast population Shown is the graph of the population function Pstd for yeast cells in a laboratory culture. Use the method of Example 1 to graph the derivative P9std. What does the graph of P9 tell us about the yeast population?
13. T adpole weights The graph shows the average body weight W as a function of time for tadpoles raised in a density of 80 tadpolesyL.
(a) What is the meaning of the derivative W9std?
(b) Sketch the graph of W9std.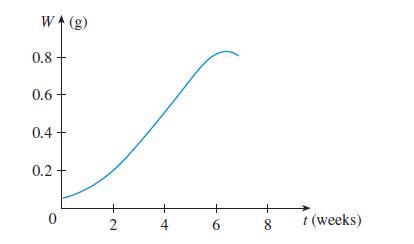
14. Ground reaction force in walking The graph shows the horizontal force Fstd exerted by the ground on a person who is walking.
(a) What is the meaning of the derivative F9std?
(b) Sketch the graph of F9std.
15. Marriage age The graph shows how the average age of first marriage of Japanese men varied in the last half of the 20th century. Sketch the graph of the derivative function M9std. During which years was the derivative negative?
16. f sxd − sin x Make a careful sketch of the graph of f and below it sketch the graph of f 9 in the same manner as in Exercises 4–11.
Can you guess a formula for f 9sxd from its graph?
17. f sxd − ex Make a careful sketch of the graph of f and below it sketch the graph of f 9 in the same manner as in Exercises 4–11.
Can you guess a formula for f 9sxd from its graph?
18. f sxd − ln x Make a careful sketch of the graph of f and below it sketch the graph of f 9 in the same manner as in Exercises 4–11.
Can you guess a formula for f 9sxd from its graph?
PA (yeast cells) 500- 0 5 10 15 t (hours)
Step by Step Solution
There are 3 Steps involved in it

Get step-by-step solutions from verified subject matter experts