

Question: As part of a quality-control study aimed at improving a production line, the weights (in ounces) of 50 bars of soap are measured. The results
Construct a normal probability plot for these data. Do these data appear to come from an approximately normal distribution?
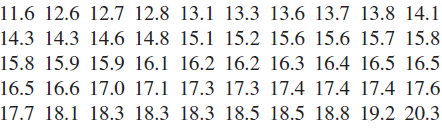
11.6 12.6 12.7 12.8 13.1 13.3 13.6 13.7 13.8 14.1 14.3 14.3 14.6 14.8 15.1 15.2 15.6 15.6 15.7 15.8 15.8 15.9 15.9 16.1 16.2 16.2 16.3 16.4 16.5 16.5 16.5 16.6 17.0 17.1 17.3 17.3 17.4 17.4 17.4 17.6 17.7 18.1 18.3 18.3 18.3 18.5 18.5 18.8 19.2 20.3
Step by Step Solution
★★★★★
3.50 Rating (167 Votes )
There are 3 Steps involved in it
1 Expert Approved Answer
Step: 1 Unlock

These data appear to come ... View full answer
Question Has Been Solved by an Expert!
Get step-by-step solutions from verified subject matter experts
Step: 2 Unlock
Step: 3 Unlock