

Question: Construct a normal probability plot for the logs of the PM data in Table 1.2. Do the logs of the PMdata appear to come from
Construct a normal probability plot for the logs of the PM data in Table 1.2. Do the logs of the PMdata appear to come from a normal population?.
Table 1.2
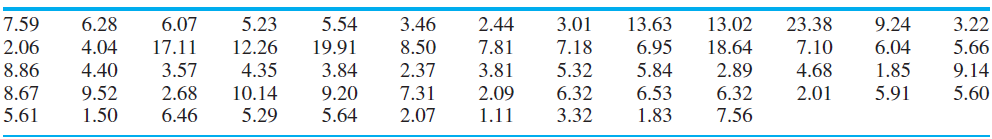
13.63 6.95 7.59 6.07 3.46 2.44 13.02 23.38 9.24 6.04 1.85 6.28 5.23 5.54 3.01 3.22 2.06 4.04 17.11 12.26 19.91 8.50 7.81 7.18 18.64 7.10 5.66 8.86 4.40 3.57 4.35 3.84 2.37 3.81 5.32 5.84 2.89 4.68 9.14 8.67 9.52 2.68 10.14 9.20 7.31 2.09 6.32 6.53 1.83 6.32 2.01 5.91 5.60 5.61 1.50 6.46 5.29 5.64 2.07 1.11 3.32 7.56
Step by Step Solution
3.44 Rating (167 Votes )
There are 3 Steps involved in it
The logs of the PM data do a... View full answer

Get step-by-step solutions from verified subject matter experts