

Question: Each of three samples has been plotted on a normal probability plot. For each, say whether the sample appears to have come from an approximately
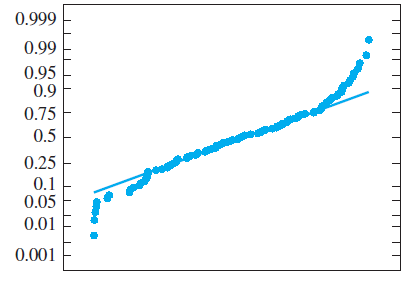
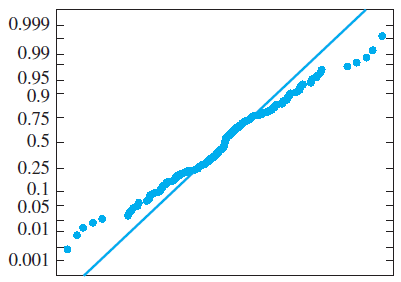
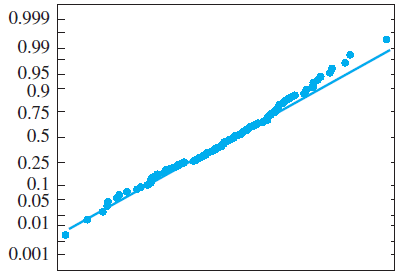
Each of three samples has been plotted on a normal probability plot. For each, say whether the sample appears to have come from an approximately normal population.
(a)
(b)
(c)
0.999 0.99 0.95 0.9 0.75 0.5 0.25 0.1 0.05 0.01 0.001 0.999 0.99 0.95 0.9 0.75 0.5 0.25 0.1 0.05 0.01 0.001
Step by Step Solution
★★★★★
3.44 Rating (170 Votes )
There are 3 Steps involved in it
1 Expert Approved Answer
Step: 1 Unlock

a N... View full answer
Question Has Been Solved by an Expert!
Get step-by-step solutions from verified subject matter experts
Step: 2 Unlock
Step: 3 Unlock