

Question: The following MINITAB output presents the results of a hypothesis test for the difference X ?? Y between two population means: a. Is
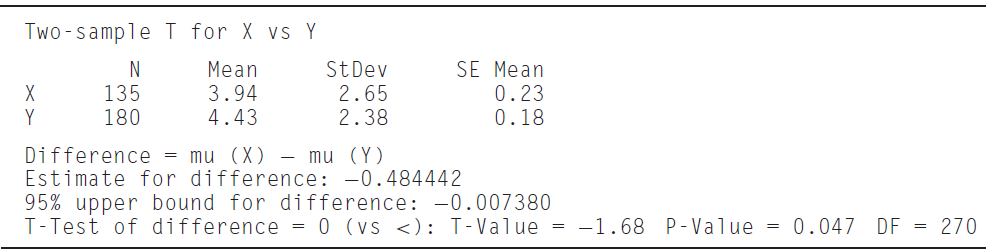
The following MINITAB output presents the results of a hypothesis test for the difference μX?? μYbetween two population means:
a. Is this a one-tailed or two-tailed test?
b. What is the null hypothesis?
c. Can H0 be rejected at the 5% level? How can you tell?
d. The output presents a Student??s t test. Compute the P-value using a z test. Are the two results similar?
e. Use the output and an appropriate table to compute a 99% confidence interval for μX??? μY based on the z statistic.
Two -sample I for X vs Y SE Mean Mean 3.94 4.43 StDev 2.65 2.38 135 0.23 0.18 Y 180 Difference = mu (X) - mu (Y) Estimate for difference: -0.484442 95% upper bound for difference: -0.007380 T-Test of difference = 0 (vs
Step by Step Solution
3.40 Rating (162 Votes )
There are 3 Steps involved in it
a Onetailed The alternate hypothesis is of the form X y b H 0 X Y 0 c ... View full answer

Get step-by-step solutions from verified subject matter experts