

Calculate the range and mean absolute deviation for the data given in question 21. Question 21 A
Question:
Calculate the range and mean absolute deviation for the data given in question 21.
Question 21
A quality control manager finds the following number of defective light bulbs in 10 cases of light bulbs: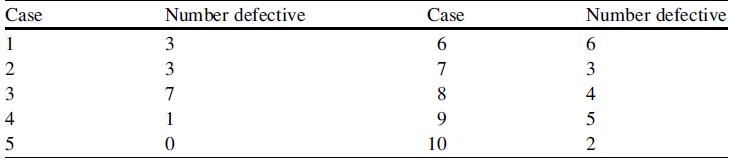
(a) Draw a frequency diagram for the class intervals 0–2 3–5 6–8 9 and over
(b) Draw a relative frequency diagram for these data.
(c) Calculate the mean, variance, and skewness for the observations and do some analysis.
Fantastic news! We've Found the answer you've been seeking!
Step by Step Answer:
To calculate the range and mean absolute deviation for the data provided we first need to organize t...View the full answer

Answered By
Keziah Thiga
I am a self motivated financial professional knowledgeable in; preparation of financial reports, reconciling and managing accounts, maintaining cash flows, budgets, among other financial reports. I possess strong analytical skills with high attention to detail and accuracy. I am able to act quickly and effectively when dealing with challenging situations. I have the ability to form positive relationships with colleagues and I believe that team work is great key to performance. I always deliver quality, detailed, original (0% plagirism), well-researched and critically analyzed papers.
1504+ Reviews
2897+ Question Solved
Related Book For 

Statistics For Business And Financial Economics
ISBN: 9781461458975
3rd Edition
Authors: Cheng Few Lee , John C Lee , Alice C Lee
Question Posted:
