

Consider the probability distribution shown here: a. Calculate , 2 , and . b. Graph p(x).
Question:
Consider the probability distribution shown here: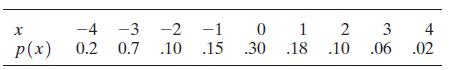
a. Calculate μ, σ2, and σ.
b. Graph p(x). Locate μ, μ - 2σ, and μ + 2σ on the graph.
c. What is the probability that x is in the interval μ ± 2σ?
Step by Step Answer:

This question has not been answered yet.
You can Ask your question!
Related Book For 

Statistics For Business And Economics
ISBN: 9781292227085
13th Global Edition
Authors: Terry Sincich James Mcclave, P. George Benson
Question Posted:
