

Question: Create a frequency polygon using data from question 44. Use the following prices of Swiss stocks to answer question. Question 44 Use your answer to
Create a frequency polygon using data from question 44.
Use the following prices of Swiss stocks to answer question.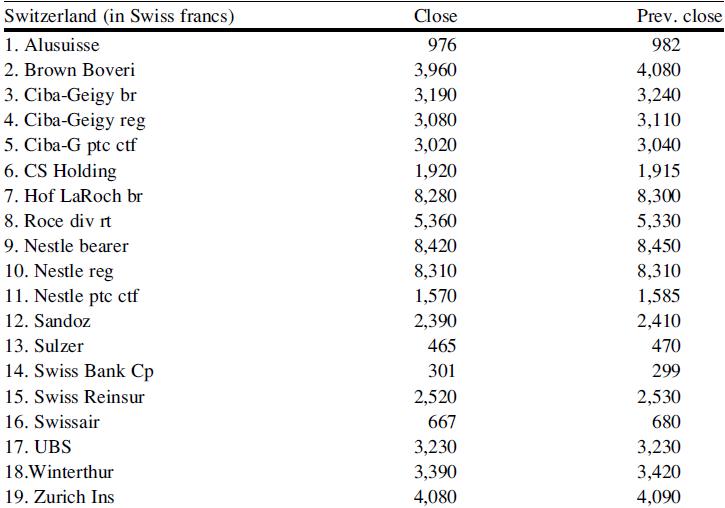
Question 44
Use your answer to question 43 to construct a tally table. Use 30-point intervals beginning with -120 ~ -91,–90 ~ -61, etc.
Use the following prices of Swiss stocks to answer question.
Question 43
Compute the change in prices by subtracting the previous closing price from the current closing price.
Use the following prices of Swiss stocks to answer question.
Switzerland (in Swiss francs) 1. Alusuisse 2. Brown Boveri 3. Ciba-Geigy br 4. Ciba-Geigy reg 5. Ciba-G ptc ctf 6. CS Holding 7. Hof LaRoch br 8. Roce div It 9. Nestle bearer 10. Nestle reg 11. Nestle ptc ctf 12. Sandoz 13. Sulzer 14. Swiss Bank Cp 15. Swiss Reinsur 16. Swissair 17. UBS 18. Winterthur 19. Zurich Ins Close 976 3,960 3,190 3,080 3,020 1,920 8,280 5,360 8,420 8,310 1,570 2,390 465 301 2,520 667 3,230 3,390 4,080 Prev. close 982 4,080 3,240 3,110 3,040 1,915 8,300 5,330 8,450 8,310 1,585 2,410 470 299 2,530 680 3,230 3,420 4,090
Step by Step Solution
3.29 Rating (161 Votes )
There are 3 Steps involved in it
To create a frequency polygon we will first need to calculate the price changes of Swiss stocks by subtracting the previous closing price from the cur... View full answer

Get step-by-step solutions from verified subject matter experts