

Educators are constantly evaluating the efficacy of public schools in the education and training of American students.
Question:
Educators are constantly evaluating the efficacy of public schools in the education and training of American students. One quantitative assessment of change over time is the difference in scores on the SAT, which has been used for decades by colleges and universities as one criterion for admission. Originally, the SAT provided scores in reading and mathematics. Now, three scores are provided: reading, mathematics, and critical writing. SAT scores for each of the 50 states and District of Columbia for the years 2014 and 2010 are saved in the accompanying file. Data for the first five and last two states are shown in the table on the next page.
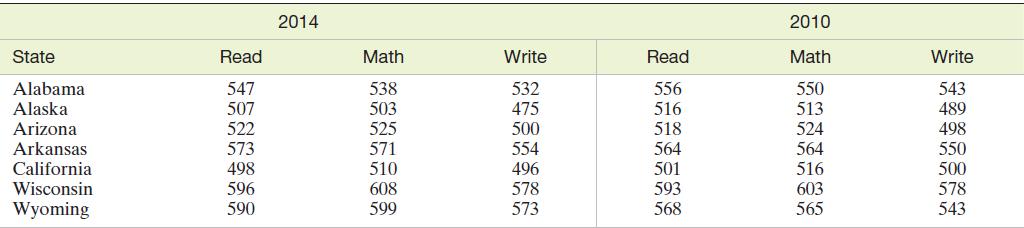
a. Use graphs to display the SAT mathematics score distributions in 2014 and 2010. How did the distributions of state scores change over the 5-year period?
b. As another method of comparing the 2014 and 2010 SAT mathematics scores, compute the paired difference by subtracting the 2010 score from the 2014 score for each state. Summarize these differences with a graph.
Compare the results with those of part a.
c. Based on the graph, part b, what is the largest improvement in SAT mathematics score? Identify the state associated with this improvement.
Step by Step Answer:

This question has not been answered yet.
You can Ask your question!


Statistics For Business And Economics
ISBN: 9781292227085
13th Global Edition
Authors: Terry Sincich James Mcclave, P. George Benson
