

On November 17, 1991, the Home News of central New Jersey used the bar chart in the
Question:
On November 17, 1991, the Home News of central New Jersey used the bar chart in the accompanying figure to show the 1980–1991 passenger traffic trends for Newark International Airport.
(a) Use these data to draw a line chart and interpret your results.
(b) Use these data to draw a stem-and-leaf diagram and interpret your results.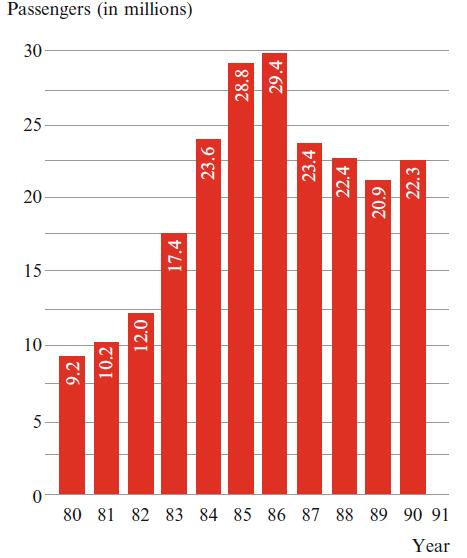
Fantastic news! We've Found the answer you've been seeking!
Step by Step Answer:
To address your question Ill guide you through creating a line chart and a stemandleaf diagram based on the data from the bar chart provided Unfortunately as I cant physically draw the charts for you ...View the full answer

Answered By
Utsab mitra
I have the expertise to deliver these subjects to college and higher-level students. The services would involve only solving assignments, homework help, and others.
I have experience in delivering these subjects for the last 6 years on a freelancing basis in different companies around the globe. I am CMA certified and CGMA UK. I have professional experience of 18 years in the industry involved in the manufacturing company and IT implementation experience of over 12 years.
I have delivered this help to students effortlessly, which is essential to give the students a good grade in their studies.
2+ Reviews
10+ Question Solved
Related Book For 

Statistics For Business And Financial Economics
ISBN: 9781461458975
3rd Edition
Authors: Cheng Few Lee , John C Lee , Alice C Lee
Question Posted:
