

Suppose a population has the uniform probability distribution given in Figure 5.8. The mean and standard deviation
Question:
Suppose a population has the uniform probability distribution given in Figure 5.8. The mean and standard deviation of this probability distribution are μ = 175 and σ = 14.43. Now suppose a sample of 11 measurements is selected from this population. Describe the sampling distribution of the sample mean x based on the 1,000 sampling experiments discussed in Example 5.3.
Example 5.3
Refer to Example 4.24. Recall that the thickness of a steel sheet follows a uniform distribution with values between 150 and 200 millimeters. Suppose we perform the following experiment over and over again: Randomly sample 11 steel sheets from the production line and record the thickness, x, of each. Calculate the two sample statistics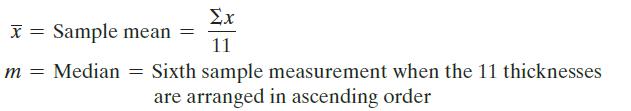
Obtain approximations to the sampling distributions of x̄ and m.
Example 4.24
Suppose the research department of a steel manufacturer believes that one of the company’s rolling machines is producing sheets of steel of varying thickness. The thickness is a uniform random variable with values between 150 and 200 millimeters. Any sheets less than 160 millimeters must be scrapped because they are unacceptable to buyers.
Step by Step Answer:
You will recall that in Example 53 we generated 1000 samples of n 11 measurements each The Min...View the full answer


Statistics For Business And Economics
ISBN: 9781292227085
13th Global Edition
Authors: Terry Sincich James Mcclave, P. George Benson
