

The accompanying scatter diagram shows the numbers of hours several students studied and their midterm scores. (a)
Question:
The accompanying scatter diagram shows the numbers of hours several students studied and their midterm scores.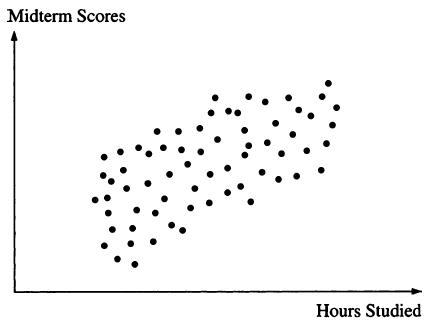
(a) Which is the dependent variable and which the independent variable?
(b) Is there a direct or an inverse relationship between hours studied and midterm score?
(c) Explain how we use regression analysis to estimate the relationship between hours studied and midterm score.
Fantastic news! We've Found the answer you've been seeking!
Step by Step Answer:

Answered By
Nyron Beeput
I am an active educator and professional tutor with substantial experience in Biology and General Science. The past two years I have been tutoring online intensively with high school and college students. I have been teaching for four years and this experience has helped me to hone skills such as patience, dedication and flexibility. I work at the pace of my students and ensure that they understand.
My method of using real life examples that my students can relate to has helped them grasp concepts more readily. I also help students learn how to apply their knowledge and they appreciate that very much.
1+ Reviews
10+ Question Solved
Related Book For 

Statistics For Business And Financial Economics
ISBN: 9781461458975
3rd Edition
Authors: Cheng Few Lee , John C Lee , Alice C Lee
Question Posted:
