

The Home News used the chart reproduced here in its September 29, 1991, issue to show the
Question:
The Home News used the chart reproduced here in its September 29, 1991, issue to show the economic growth record for 12 different periods since World War II.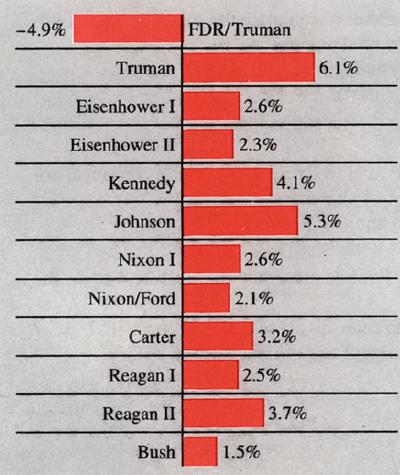
(a) Calculate the mean and the median.
(b) Calculate the standard deviation and mean absolute deviation.
(c) Calculate the Z scores and do related analysis.
Fantastic news! We've Found the answer you've been seeking!
Step by Step Answer:
To answer your questions on the economic growth record I need to first compile the data given in the chart into a list Here are the economic growth pe...View the full answer

Answered By
Utsab mitra
I have the expertise to deliver these subjects to college and higher-level students. The services would involve only solving assignments, homework help, and others.
I have experience in delivering these subjects for the last 6 years on a freelancing basis in different companies around the globe. I am CMA certified and CGMA UK. I have professional experience of 18 years in the industry involved in the manufacturing company and IT implementation experience of over 12 years.
I have delivered this help to students effortlessly, which is essential to give the students a good grade in their studies.
2+ Reviews
10+ Question Solved
Related Book For 

Statistics For Business And Financial Economics
ISBN: 9781461458975
3rd Edition
Authors: Cheng Few Lee , John C Lee , Alice C Lee
Question Posted:
