

Use a histogram to graph the cumulative frequencies. Use the following information to answer question. Suppose a
Question:
Use a histogram to graph the cumulative frequencies.
Use the following information to answer question. Suppose a class of high school seniors had the following distribution of SAT scores in English.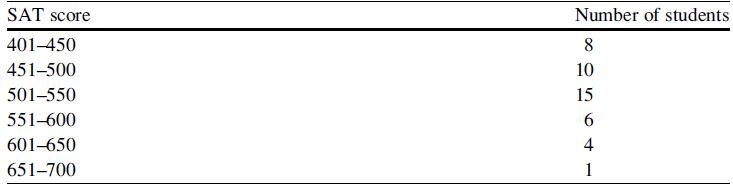
Fantastic news! We've Found the answer you've been seeking!
Step by Step Answer:
Im unable to create and display images directly However I can guide you through the process of creating a histogram with cumulative frequencies using ...View the full answer

Answered By
Larlyu mosoti
I am a professional writer willing to do several tasks free from plagiarism, grammatical errors and submit them in time. I love to do academic writing and client satisfaction is my priority. I am skilled in writing formats APA, MLA, Chicago, and Harvard I am a statistics scientist and I can help out in analyzing your data. I am okay with SPSS, EVIEWS, MS excel, and STATA data analyzing tools.
Statistical techniques: I can do linear regression, time series analysis, logistic regression, and some basic statistical calculations like probability distributions. . I'm ready for your working projects!
Services I would offer:
• Academic writing.
• Article writing.
• Data entry.
• PDF conversion.
• Word conversion
• Proofreading.
• Rewriting.
• Data analyzing.
The best reason to hire me:
- Professional and Unique work in writing.
- 100% satisfaction Guaranteed
- within required time Express delivery
- My work is plagiarism Free
- Great communication
My passion is to write vibrantly with dedication. I am loyal and confident to give my support to every client. Because Client satisfaction is much more important to me than the payment amount. A healthy client-contractor relationship benefits in the longer term. Simply inbox me if you want clean work.
3+ Reviews
10+ Question Solved
Related Book For 

Statistics For Business And Financial Economics
ISBN: 9781461458975
3rd Edition
Authors: Cheng Few Lee , John C Lee , Alice C Lee
Question Posted:
