

Use the data from question 47 to compute the sample correlation coefficient r between x and y.
Question:
Use the data from question 47 to compute the sample correlation coefficient r between x and y. Use a t-test to test the significance of r.
Question 47
Use the data and the regression given in question 19 to forecast the number of bushels of wheat that will be harvested if 250 lb of fertilizer are used. Construct a 90 % and a 99 % confidence belt for the regression line. For which interval is the confidence belt wider? Explain.
Question 19
Ralph Farmer of the Department of Agriculture is interested in the relationship between the amount of fertilizer used and the number of bushels of wheat harvested. He collects the following information on six farmers.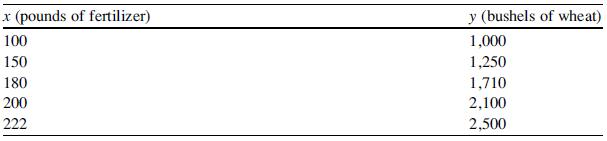
Use MINITAB to do the following:
(a) Draw a scatter diagram for the data.
(b) Estimate the regression parameters for a and b.
(c) Calculate the standard error of the estimate and the standard error of the coefficient b.
(d) Calculate the t-value for the coefficient of b.
(e) If 210 lb of fertilizer is used, what amount of wheat can be expected to be harvested? What is the 95 % confidence interval?
Step by Step Answer:

This question has not been answered yet.
You can Ask your question!


Statistics For Business And Financial Economics
ISBN: 9781461458975
3rd Edition
Authors: Cheng Few Lee , John C Lee , Alice C Lee
