

Use the data given in question 21 to construct a bar graph for 1985 through 1989. Question
Question:
Use the data given in question 21 to construct a bar graph for 1985 through 1989.
Question 21
In the course of researching the benefits of diversification, you collect the information given in the table on page 47 (top), which presents rates of return for different portfolios.
(a) Use a line chart to plot the 20-year return for all five portfolios.
(b) What information do these plots provide?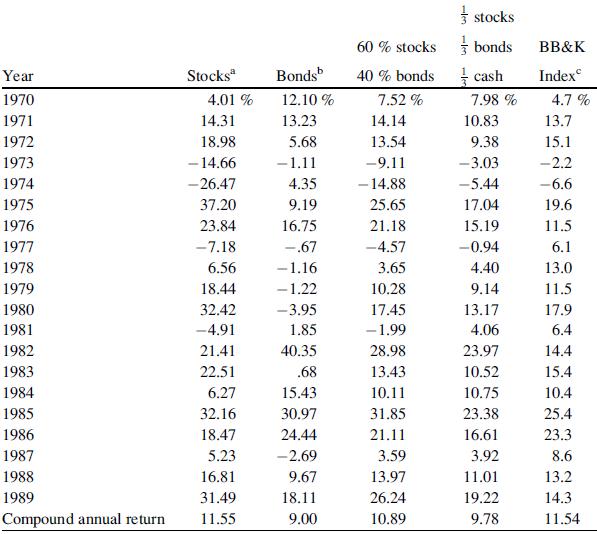
Table on page 47
Fantastic news! We've Found the answer you've been seeking!
Step by Step Answer:
To construct a bar graph for the years 1985 through 1989 ...View the full answer

Answered By
Utsab mitra
I have the expertise to deliver these subjects to college and higher-level students. The services would involve only solving assignments, homework help, and others.
I have experience in delivering these subjects for the last 6 years on a freelancing basis in different companies around the globe. I am CMA certified and CGMA UK. I have professional experience of 18 years in the industry involved in the manufacturing company and IT implementation experience of over 12 years.
I have delivered this help to students effortlessly, which is essential to give the students a good grade in their studies.
2+ Reviews
10+ Question Solved
Related Book For 

Statistics For Business And Financial Economics
ISBN: 9781461458975
3rd Edition
Authors: Cheng Few Lee , John C Lee , Alice C Lee
Question Posted:
