

An experiment was conducted to compare four Web browsers on their ability to display graphics. (Journal of
Question:
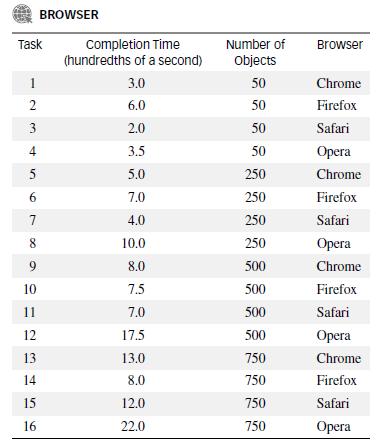
An experiment was conducted to compare four Web browsers on their ability to display graphics. (Journal of Graphic Engineering Design, Vol. 3, 2012.) The four browsers were the latest versions of Google Chrome, Mozilla Firefox, Opera and Apple Safari. Each browser was tested on its ability to generate 50, 250, 500, and 750 simple objects (graphs). For each of these four tasks, the average completion time (in hundredths of a second) was determined. The data (simulated from information provided in the journal article) are provided in the accompanying table.
a. Hypothesize a first-order, interaction model for completion time (y) as a function of number of objects (x1) and browser type.
b. Fit the model, part a, to the data. Conduct a test of overall model adequacy (at α = .05).
c. Give an estimate of the rate of change of completion time with number of objects when using the Chrome browser.
Step by Step Answer:


Statistics For Engineering And The Sciences
ISBN: 9781498728850
6th Edition
Authors: William M. Mendenhall, Terry L. Sincich
