

Question: Digital elevation models (DEM) are now used to estimate elevations and slopes of remote regions. In Arctic, Antarctic, and Alpine Research (May 2004), geographers analyzed
Digital elevation models (DEM) are now used to estimate elevations and slopes of remote regions. In Arctic, Antarctic, and Alpine Research (May 2004), geographers analyzed reading errors from maps produced by DEM. Two readers of a DEM map of White Glacier (Canada) estimated elevations at 400 points in the area. The difference between the elevation estimates, Y, of the two readers had a mean of μ = .28 meter and a standard deviation of σ = 1.6 meters. A histogram for Y (with a normal histogram superimposed on the graph) is shown below.
a. Based on the histogram, the researchers concluded that Y is not normally distributed. Why?
b. Will the interval μ = ±2σ contain more than 95%, exactly 95%, or less than 95% of the 400 elevation differences? Explain.
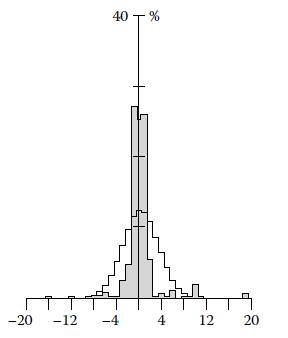
40 T % -20 -12 -4 4 12 20
Step by Step Solution
3.44 Rating (157 Votes )
There are 3 Steps involved in it
a The histogram shows that the data is skewed to the left indicating th... View full answer

Get step-by-step solutions from verified subject matter experts