

Question: Electronics products (e.g., backplanes, complex motherboards for server systems, etc.) can have as many as thousands of opportunities for defects per printed circuit board (PCB).
Electronics products (e.g., backplanes, complex motherboards for server systems, etc.) can have as many as thousands of opportunities for defects per printed circuit board (PCB). The defects can be traced to improper solder joints (potentially thousands on a PCB), missing components, improperly placed components, and others. (International Journal of Industrial Engineering, Vol. 16, 2009). The data in the table represent the total number of defects per day in a PCB assembly process where 100 PCB assemblies are inspected each day, for 24 consecutive days.
a. Construct a c-chart for the data. Is the process in control?
b. Each PCB assembly has 3,000 opportunities for defects. Because there are so many opportunities for defects, quality control engineers are interested in the average number of defects per million opportunities (or, dpmo). The author of the journal article demonstrated how to convert a standard defects c-chart into a dpmo-chart. The points plotted in the chart are calculated as follows:
dpmo = (1,000,000)(c/n)/(number of defect opportunities per unit)
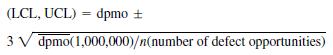
dpmo (number of defect opportunities per unit) where c is the total number of defects per day and n is the number of units inspected per day. The center line is the average dpmo, i.e., d̅p̅m̅o̅ = Σ dpmo/k, where the number of subgroups (days). The lower and upper control limits are:
For this application, n = 100 PCB assemblies per day, k = 24 days, and number of defect opportunities = 3,000. Use this information to construct a dpmo-chart for the data. Interpret the resulting graph. 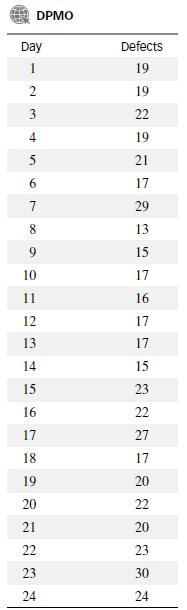
(LCL, UCL) = dpmo + 3 V dpmo(1,000,000)/n(number of defect opportunities)
Step by Step Solution
3.36 Rating (171 Votes )
There are 3 Steps involved in it

Get step-by-step solutions from verified subject matter experts