

In a classic research paper, Hamilton (1987) illustrated the multicollinearity problem with an example using the data
Question:
In a classic research paper, Hamilton (1987) illustrated the multicollinearity problem with an example using the data shown in the next table. The values of x1, x2, and y in the table represent appraised land value, appraised improvements value, and sale price, respectively, of a randomly selected residential property. (All measurements are in thousands of dollars.)
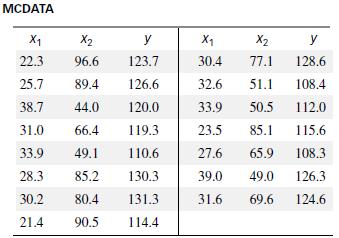
a. Calculate the coefficient of correlation between y and x1. Is there evidence of a linear relationship between sale price and appraised land value?
b. Calculate the coefficient of correlation between y and x2. Is there evidence of a linear relationship between sale price and appraised improvements?
c. Based on the results in parts a and b, do you think the model E(y) = βo + β1x1 + β2x2 will be useful for predicting sale price?
E1y2 = b0 + b1x1
d. Fit the model in part c, and conduct a test of model adequacy. In particular, note the value of R2. Does the result agree with your answer to part c?
e. Calculate the coefficient of correlation between x1 and x2. What does the result imply?
f. Many researchers avoid the problems of multicollinearity by always omitting all but one of the “redundant” variables from the model. Would you recommend this strategy for this example? Explain.
Step by Step Answer:
To answer the questions based on the given data lets perform the necessary calculations and analysis a To calculate the coefficient of correlation between y and x1 sale price and appraised land value ...View the full answer


Statistics For Engineering And The Sciences
ISBN: 9781498728850
6th Edition
Authors: William M. Mendenhall, Terry L. Sincich
