

In Quality Engineering (Vol. 25, 2013), statisticians at Minitab, Inc., applied control chart methodology to monitor the
Question:
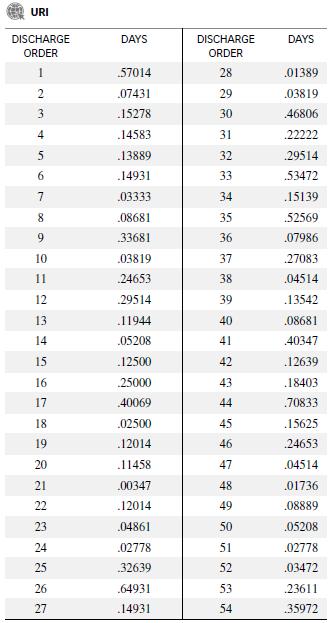
In Quality Engineering (Vol. 25, 2013), statisticians at Minitab, Inc., applied control chart methodology to monitor the time between discharges of male patients with hospital-acquired urinary tract infections (URI). The data (days between discharges) for n = 54 consecutive URI discharges at a large hospital system are shown in the table.
a. Construct a control chart for the variable, time between discharges (in days). Does the process appear to be in control?
b. The statisticians demonstrated that time between discharges follows an exponential distribution rather than a normal distribution. Consequently, the control limits on the control chart, part a, will not yield the rare event probabilities that form the basis of control chart methodology. They derived the control limits for an exponential random variable with mean θ as follows:
LCL = .001351(θ), Center line = θln(2), UCL = 6.60773(θ)
Show that for an exponential random variable Y, P(Y < LCL) = P(Y > UCL) ≈ .001 and P(Y > Center line) = .5.
c. Use the control limits given in part b and the fact that the mean time between discharges is .21 days to construct a control chart for the time between urinary tract infections. Does the process appear to be in control now?
Step by Step Answer:


Statistics For Engineering And The Sciences
ISBN: 9781498728850
6th Edition
Authors: William M. Mendenhall, Terry L. Sincich
