

Refer to Exercises 16.16 and 16.25 and the hourly data collected by BPI consulting. Conduct a runs
Question:
Refer to Exercises 16.16 and 16.25 and the hourly data collected by BPI consulting. Conduct a runs analysis on both the x̅-chart and the R-chart. Interpret the results.
Data from Exercise 16.16
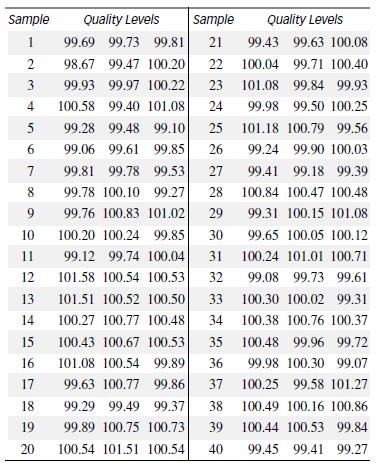
BPI Consulting, a leading provider of statistical process control software and training in the United States, recently alerted its clients to problems with “chunky” data. In an April 2007 report, BPI Consulting identified “chunky” data as data that result when the range between possible values of the variable of interest becomes too large. This typically occurs when the data are rounded. For example, a company monitoring the time it takes shipments to arrive from a given supplier rounded off the data to the nearest day. To show the effect of chunky data on a control chart, BPI Consulting considered a process with a quality characteristic that averages about 100. Data on the quality characteristic for a random sample of three observations collected each hour for 40 consecutive hours are given in the accompanying table.
Step by Step Answer:


Statistics For Engineering And The Sciences
ISBN: 9781498728850
6th Edition
Authors: William M. Mendenhall, Terry L. Sincich
