

Refer to the Corrosion Science (Sept. 1993) study on the resistivity of an amorphous iron boronsilicon alloy
Question:
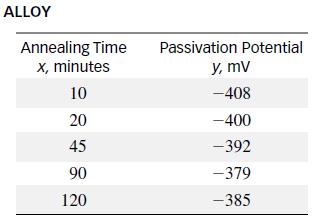
Refer to the Corrosion Science (Sept. 1993) study on the resistivity of an amorphous iron– boron–silicon alloy after crystallization, Exercise 10.74. Five alloy specimens were annealed at 700°C, each for a different length of time. The passivation potential—a measure of resistivity of the crystallized alloy—was then measured for each specimen. The experimental data are reproduced here.
a. Calculate Spearman’s correlation coefficient between annealing time (x) and passivation potential ( y). Interpret the result.
b. Use the result, part a, to test for a significant correlation between annealing time and passivation potential. Use α = .10.
Data from Exercise 10.74
High-resolution images of lapetus, one of Saturn’s largest moons, were recently obtained by the Cassini spacecraft and analyzed by NASA (Science, Feb. 25, 2005). Using wideband filters, the ratios of ultraviolet to green and infrared to green wavelengths were measured at 24 moon locations. These color ratios are listed in the table below. According to the researchers, “the data’s linear trend suggests mixing of two end members: Cassini Regio with a red spectrum and the south polar region with a flat spectrum.” Conduct a complete simple linear regression analysis of the data, including a residual analysis. Do the results support the researchers’ statement?
Step by Step Answer:


Statistics For Engineering And The Sciences
ISBN: 9781498728850
6th Edition
Authors: William M. Mendenhall, Terry L. Sincich
