

Refer to the data on sanitation levels of cruise ships, Exercise 2.17. a. Use the box plot
Question:
Refer to the data on sanitation levels of cruise ships, Exercise 2.17.
a. Use the box plot method to detect any outliers in the data.
b. Use the z-score method to detect any outliers in the data.
c. Do the two methods agree? If not, explain why.
Data from Exercise 2.17
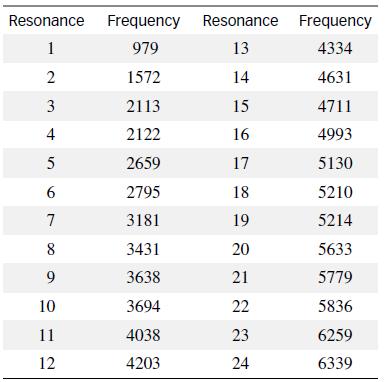
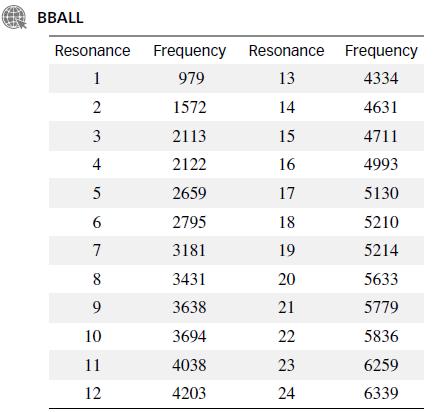
An experiment was conducted to characterize sound waves in a spherical cavity. American Journal of Physics, June , 2010.) A fully inflated basketball, hanging from rubber bands, was struck with a metal rod, producing a series of metallic sounding pings. Of particular interest were the frequencies of sound waves resulting from the first 24 resonances (echoes). A mathematical formula, well known in physics, was used to compute the theoretical frequencies
Step by Step Answer:
To detect any outliers in the data using the box plot method and the zscore method we first need to organize the data It seems like there are two sets ...View the full answer


Statistics For Engineering And The Sciences
ISBN: 9781498728850
6th Edition
Authors: William M. Mendenhall, Terry L. Sincich
