

Question: Refer to the study on predicting defects in software code written in C language for a NASA spacecraft instrument, Exercise 9.29. The SPSS contingency table
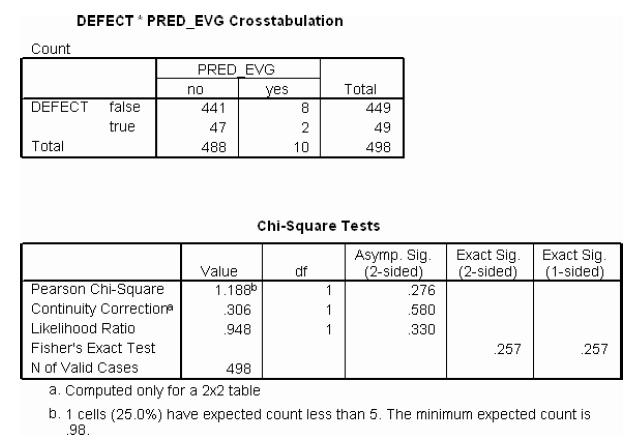
Refer to the study on predicting defects in software code written in C language for a NASA spacecraft instrument, Exercise 9.29. The SPSS contingency table for the two categorical variables, actual defective status and predicted defective status using EVG, is reproduced.
a. Show that there are 11 possible contingency tables (including the observed table) with the same marginal totals as the observed table.
b. Use the hypergeometric formula to find the probability of each of the 11 tables in part a.
c. Use the probabilities, part b, to find the p-value of Fisher’s exact test for independence. Verify your calculations by checking the p-value shown on the SPSS printout.
d. Since the sample size is large, the p-value for the asymptotic chi-square test should be approximately equal to Fisher’s exact test p-value. Is this true?
Data from Exercise 9.29
The PROMISE Software Engineering Repository, hosted by the School of Information Technology and Engineering, University of Ottawa, provides researchers with data sets for building predictive software models. (See Statistics in Action, Chapter 3.) Data on 498 modules of software code written in C language for a NASA spacecraft instrument are saved in the SWDEFECTS file. Recall that each module was analyzed for defects and classified as “true” if it contained defective code and “false” if not. One algorithm for predicting whether or not a module has defects is “essential complexity” (denoted EVG), where a module with at least 15 sub flow graphs with D-structured primes is predicted to have a defect. When the method predicts a defect, the predicted EVG value is “yes”; otherwise, it is “no.”
DEFECT PRED EVG Crosstabulation Count PRED EVG yes 8 no Total DEFECT false 441 449 true 47 49 Total 488 10 498 Chi-Square Tests Asymp. Sig. (2-sided) Exact Sig. Exact Sig. (1-sided) (2-sided) Value df Pearson Chi-Square Continuity Correctione 1.188b 1. 276 306 1 .580 Likelihood Ratio .948 1 330 Fisher's Exact Test 257 257 N of Valid Cases 498 a. Computed only for a 2x2 table b. 1 cells (25.0%) have expected count less than 5. The minimum expected count is 98.
Step by Step Solution
3.48 Rating (165 Votes )
There are 3 Steps involved in it
The SPSS output includes a contingency table for the actual defective status versus the predicted defective status using the EVG method as well as the results from several statistical tests for indepe... View full answer

Get step-by-step solutions from verified subject matter experts