

Question: 12.57 The data shown in the table below: are for a factorial experiment with two observations per factor-level combination. a Perform an analysis of variance
12.57 The data shown in the table below: are for a factorial experiment with two observations per factor-level combination.
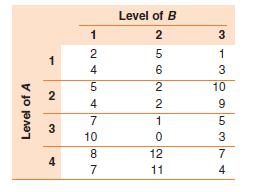
a Perform an analysis of variance for the data and display the results in an analysis of variance table.
b Do the data provide sufficient information to indicate an interaction between the factors?
Test by using 0.05.
c Suppose the objective of the experiment is to select the factor-level combination with the largest mean. Based on the data and using a simultaneous confidence coefficient of approximately 0.90, which pairs of means appear to differ?
Level of A 3 1 2 10 562210 124647 Level of B 2 3 1 3 10 9 5 3 8 12 7 4 7 11 4
Step by Step Solution
There are 3 Steps involved in it

Get step-by-step solutions from verified subject matter experts