

Question: 17. The following data represent the relationship between the number of alignment errors and the number of missing rivets for 10 different aircraft. a. Plot
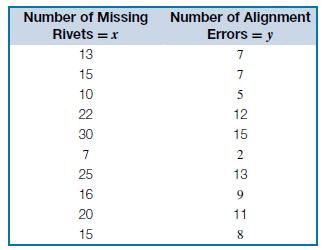
17. The following data represent the relationship between the number of alignment errors and the number of missing rivets for 10 different aircraft.
a. Plot a scatter diagram.
b. Estimate the regression coefficients.
c. Test the hypothesis that α = 1.
d. Estimate the expected number of alignment errors of a plane having 24 missing rivets.
e. Compute a 90 percent confidence interval estimate for the quantity in (d).
Number of Missing Rivets = x 13 15 Number of Alignment Errors = y 7 7 Na 10 5 22 12 30 15 2 25 13 16 9 20 11 15 8
Step by Step Solution
There are 3 Steps involved in it
1 Expert Approved Answer
Step: 1 Unlock

Question Has Been Solved by an Expert!
Get step-by-step solutions from verified subject matter experts
Step: 2 Unlock
Step: 3 Unlock