

Question: Data augmentation. The table below shows the observed frequencies yj related to the observed phenotype defined by the blood group of an individual, for a
Data augmentation. The table below shows the observed frequencies yj related to the observed phenotype defined by the blood group of an individual, for a sample of n = 435 individuals. Here j ∈ {1, 2, 3, 4} indexes the four blood groups O, A, B, AB.
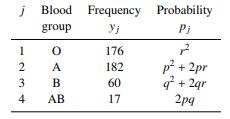
The probabilities pj are determined by the laws of genetics, with p, q, and r being the probabilities of the genes of type A, B, and O, respectively, with p + q + r = 1.
a. Find the likelihood function f(y | θ) under this model for θ = (p, q) and using r = 1 − p − q.
b. The observed phenotype (blood group) depends on the genotype which cannot be directly observed. Following is the relationship between genotype and phenotype:
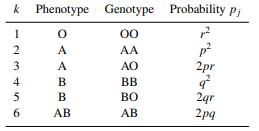
Let zi ∈ {1, . . . , 6} denote the unobserved genotype for individual i, i = 1, . . . , n, and let z = (z1, . . . ,zn). Write a complete data likelihood f(y |
z, θ).
c. Using the latent variables z from
(b) and completing the model with a suitable prior h(θ), propose a Gibbs sampling scheme to generate (θ,z) ∼
h(θ,z | y).
j Blood Frequency Probability group yj Pj 1 O 176 2 2 A 182 p +2pr 3 B 60 q+2gr 4 AB 17 2pq
Step by Step Solution
There are 3 Steps involved in it

Get step-by-step solutions from verified subject matter experts