

Question: For the following data we will consider two competing models: H1: a linear regression, versus H2 : a quadratic regression. Model H1: with 1 and
For the following data we will consider two competing models: H1: a linear regression, versus H2 : a quadratic regression.
Model H1:
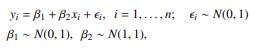
with β1 and β2 a priori independent. Model H2:
![]()
with γ1, γ2, γ3 a priori independent.
a. Find the marginal distributions p(y | H1) = R f(y | β, H1) h(β) dβ. and p(y | H2) = R f(y | γ, H2) h(γ) dγ.
b. Write down the Bayes factor B = p(y | H2)/p(y | H1) for comparing model H1 versus model H2 and evaluate it for the given data set.
c. We now replace the prior distributions by improper constant priors: h(β) = c1 in model H1; and h(γ) = c2 in model H2. We can still formally evaluate integrals2 R f(y | β, H1) h(β) dβ and R f(y | γ, H2) h(γ) dγ and define a Bayes factor, ![]()
Show that the value of the Bayes factor B˜ depends on the – arbitrarily chosen – constants c1 and c2.
d. Evaluate the Bayes factor using the harmonic mean estimator (5.31) and compare with the exact evaluation from b.
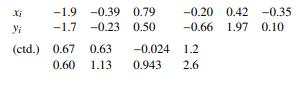
Xi -1.9 -0.39 0.79 -0.20 0.42 -0.35 Yi -1.7 -0.23 0.50 -0.66 1.97 1.97 0.10. (ctd.) 0.67 0.63 -0.024 1.2 0.60 1.13 0.943 2.6
Step by Step Solution
There are 3 Steps involved in it

Get step-by-step solutions from verified subject matter experts