

Question: Refer to the file lung.csv. a. Construct a histogram for the values of FEV1. b. Is the histogram symmetric, skewed to the left, or skewed
Refer to the file lung.csv.
a. Construct a histogram for the values of FEV1.
b. Is the histogram symmetric, skewed to the left, or skewed to the right?
c. Construct a boxplot for the values of FEV1.
d. Are there any outliers in these data? If so, are they unusually large or unusually small values?
Exercises 22-24 involve data sets described in Appendix C. These data sets are available in the Instructor Resources.
Lung Data Set:
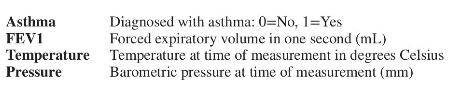
Forced expiratory volume (FEV) is a measure of lung function which is obtained by having a person fill their lungs with as much air as possible, then blowing as hard as they can into a tube. The volume of air expelled in one second is known as FEV1.
In a study to assess the effect of various factors on the lung capacity of children and adolescents, students in fourth through twelfth grade had their FEV1 measured, along with other variables that might affect the value of FEV1. In particular, levels of exposure to various air pollutants were measured. These were ozone, PM10 (concentration of particles \(10 \mu \mathrm{m}\) or less in diameter), and \(\mathrm{NO}_{2}\). Following is a list of the variables in this data set:
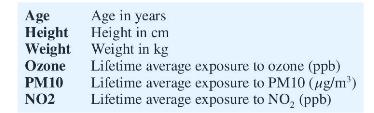
Age Height Weight Age in years Height in cm Weight in kg Ozone Lifetime average exposure to ozone (ppb) PM10 Lifetime average exposure to PM10 (g/m) NO2 Lifetime average exposure to NO (ppb)
Step by Step Solution
3.42 Rating (155 Votes )
There are 3 Steps involved in it
To answer your questions we would usually need access to the lungcsv data file However since I cannot directly access files I can guide you through th... View full answer

Get step-by-step solutions from verified subject matter experts