Refer to the file pit.csv. a. Consider the pits at 52 weeks duration. Construct comparative boxplots for
Question:
Refer to the file pit.csv.
a. Consider the pits at 52 weeks duration. Construct comparative boxplots for the depths at \(40 \%\) and \(75 \%\) relative humidity.
b. Using the boxplots, what differences can be seen in the distributions of depths at \(40 \%\) and \(75 \%\) relative humidity?
Exercises 22-24 involve data sets described in Appendix C. These data sets are available in the Instructor Resources.
Data From Pit Data Set:
In an experiment to measure corrosion in stainless steel, several pieces of stainless steel were exposed to salt particles for various lengths of time, at relative humidities of \(40 \%\) and \(75 \%\). The exposure caused pits to form. After exposure, the depths of the pits were measured, and those greater than \(10 \mu \mathrm{m}\) were reported.
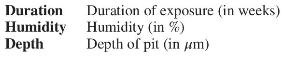
Each row of the data set represents one pit. Variables are the depth of the pit, the duration of exposure, and the relative humidity. Following is a list of the variables in this data set:
Step by Step Answer: