

Question: The data shown in the following table and stored in Solar Power represent the yearly a mount of solar power generated by utilities (in millions
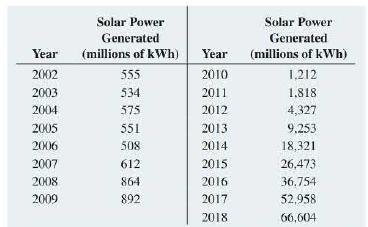
The data shown in the following table and stored in Solar Power represent the yearly a mount of solar power generated by utilities (in millions of kWh) in the United States from 2002 through 2018:
a. Plot the data.
b. Compute a linear trend forecasting equation and plot the trend line.
c. Compute a quadratic trend forecasting equation and plot the results.
d. Compute an exponential trend forecasting equation and plot the results.
e. Using the models in (b) through (d), what are your annual trend forecasts of the yearly amount of so lar power generated by utilities (in millions of kWh) in the United States in 2019 and 2020?
Solar Power Solar Power Generated Generated Year (millions of kWh) Year (millions of kWh) 2002 555 2010 1,212 2003 534 2011 1.818 2004 575 2012 4,327 2005 551 2013 9.253 2006 508 2014 18,321 2007 612 2015 26,473 2008 864 2016 36,754 2009 892 2017 52,958 2018 66,604
Step by Step Solution
3.51 Rating (171 Votes )
There are 3 Steps involved in it
aUSING EXCELSTEP 1 PLOT THE DATA BUSING EXCEL tr... View full answer

Get step-by-step solutions from verified subject matter experts