

Question: A national survey asked people, How often do you have dinner outside instead of at home? The frequencies were as follows. (a) Construct a relative
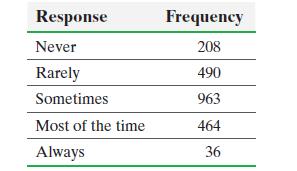
A national survey asked people, “How often do you have dinner outside instead of at home?” The frequencies were as follows.
(a) Construct a relative frequency distribution.
(b) What percentage of respondents answered “Always”?
(c) What percentage of respondents answered “Never” or “Rarely”?
(d) Construct a frequency bar graph.
(e) Construct a relative frequency bar graph.
(f) Construct a pie chart.
(g) Suppose a person claims that, “1.7% of all people in the nation always eat out.” Is this a descriptive or inferential statement?
Response Frequency Never 208 Rarely 490 Sometimes 963 Most of the time 464 Always 36
Step by Step Solution
There are 3 Steps involved in it

Get step-by-step solutions from verified subject matter experts