

Question: A nutritionist wants to develop a model that describes the relation between the calories, total fat content, protein, sugar, and carbohydrates in cheeseburgers at fast-food
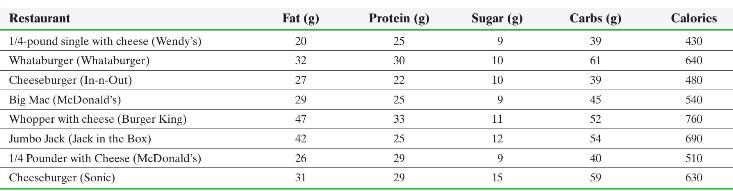
A nutritionist wants to develop a model that describes the relation between the calories, total fat content, protein, sugar, and carbohydrates in cheeseburgers at fast-food restaurants. She obtains the following data from the websites of the companies. She will use calories as the response variable and the others as explanatory variables.
(a) Construct a correlation matrix. Is there any reason to be concerned about multicollinearity?
(b) Find the least-squares regression equation \(\hat{y}=b_{0}+\) \(b_{1} x_{1}+b_{2} x_{2}+b_{3} x_{3}+b_{4} x_{4}\), where \(x_{1}\) is fat content, \(x_{2}\) is protein, \(x_{3}\) is sugar, \(x_{4}\) is carbohydrates, and \(y\) is the response variable, calories.
(c) Test \(H_{0}: \beta_{1}=\beta_{2}=\beta_{3}=\beta_{4}=0\) versus \(H_{1}\) : at least one of the \(\beta_{i} eq 0\) at the \(\alpha=0.05\) level of significance.
(d) Test the hypotheses \(H_{0}: \beta_{i}=0\) versus \(H_{1}: \beta_{i} eq 0\) for \(i=1,2,3,4\) at the \(\alpha=0.05\) level of significance. Should any of the explanatory variables be removed from the model? If so, which one?
(e) Determine the regression model with the explanatory variable identified in part
(d) removed. Are the remaining slope coefficients significantly different from zero? If not, remove the appropriate explanatory variable and compute the least-squares regression equation.
(f) Draw residual plots, a boxplot of the residuals, and a normal probability plot of the residuals to assess the adequacy of the model found in part (e).
(g) Interpret the regression coefficients for the least-squares regression equation found in part (e).
(h) Determine and interpret \(R^{2}\) and the adjusted \(R^{2}\).\
(i) Construct \(95 \%\) confidence and prediction intervals for the calories in a fast-food cheeseburger that has \(38 \mathrm{~g}\) of fat, \(29 \mathrm{~g}\) of protein, \(11 \mathrm{~g}\) of sugar, and \(52 \mathrm{~g}\) of carbohydrates. Interpret the results.
Restaurant Fat (g) Protein (g) Sugar (g) Carbs (g) Calories 1/4-pound single with cheese (Wendy's) 20 25 9 39 430 Whataburger (Whataburger) 32 30 10 61 640 Cheeseburger (In-n-Out) 27 22 10 39 480 Big Mac (McDonald's) 29 25 9 45 540 Whopper with cheese (Burger King) 47 33 11 52 760 Jumbo Jack (Jack in the Box) 42 25 12 54 690 1/4 Pounder with Cheese (McDonald's) Cheeseburger (Sonic) 26 29 9 40 510 31 29 15 59 630
Step by Step Solution
3.49 Rating (152 Votes )
There are 3 Steps involved in it
a There is no reason to be concerned about multicollinearity b haty11990765 x144676 x21488 x335202 x4 c Since the Pvalue 0001leftF0115797 ight we reje... View full answer

Get step-by-step solutions from verified subject matter experts