

Question: An avid backyard birder is comparing two different feeder designs to see which attracts more birds. She purchases three of each type of feeder and
An avid backyard “birder” is comparing two different feeder designs to see which attracts more birds. She purchases three of each type of feeder and hangs each at randomly chosen locations. She switches the locations every day. On six different days, she measures the amount of food consumed at each feeder, in ounces. The data are given in Table 10.23.
(a) Analyze the data recognizing that days are acting as blocks.
(b) Show that ignoring the blocks, and analyzing the data as if it were two independent samples, gives a much less powerful result.
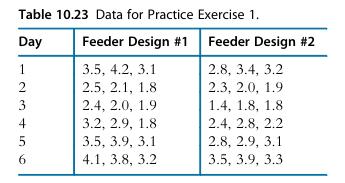
Table 10.23 Data for Practice Exercise 1. Day Feeder Design #1 Feeder Design #2 1 3.5, 4.2, 3.1 2.8, 3.4, 3.2 2356 2.5, 2.1, 1.8 2.3, 2.0, 1.9 2.4, 2.0, 1.9 1.4, 1.8, 1.8 4 3.2, 2.9, 1.8. 2.4, 2.8, 2.2 3.5, 3.9, 3.1 2.8, 2.9, 3.1 4.1, 3.8, 3.2 3.5, 3.9, 3.3
Step by Step Solution
3.36 Rating (149 Votes )
There are 3 Steps involved in it

Get step-by-step solutions from verified subject matter experts