

Question: Cochran and Chamlin (2006) used data from the National Opinion Research Council General Social Survey (NORC-GSS) to compare Whites and Backs opinions of the death
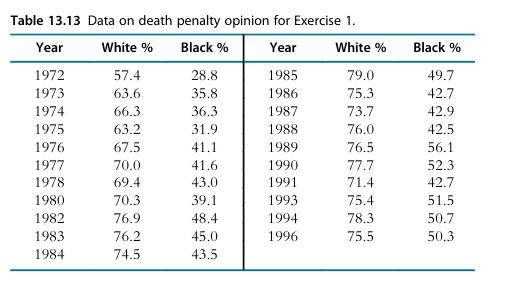
Cochran and Chamlin (2006) used data from the National Opinion Research Council General Social Survey (NORC-GSS) to compare Whites’ and Backs’ opinions of the death penalty. The data consisted of responses from 32,937 participants collected between 1972 and 1996. (The question was not asked every year.) The outcome variable was whether the respondent did or did not support the death penalty. Their hypotheses concerned both the possible difference between Blacks and Whites, and the possible change in that difference over time. The authors provided a table of the percentage of Whites and Blacks each year that supported the death penalty, shown in Table 13.13.
(a) Convert the percentages given in Table 13.13 to the ln(odds) within each race and year, and plot the ln(odds) versus year. Comment on any patterns you see.
If there is a trend in time, does it appear linear or quadratic?
(b) Use logistic regression to model the probability a person will support the death penalty, as a function of race and year. Is there significant evidence that a quadratic term in year improves the model? Assume that in each year’s sample there were 1100 Whites and 400 Blacks.
(c) Attempt to improve your model by adding interactions of race with the linear and quadratic variables in time. Do the interactions significantly improve the model?
(d) The authors of the study refer to the gap between White and Black support as “enduring.” Are your results in part
(c) consistent with this?
Table 13.13 Data on death penalty opinion for Exercise 1. Year White % Black % Year White % Black % 1972 57.4 28.8 1985 79.0 49.7 1973 63.6 35.8 1986 75.3 42.7 1974 66.3 36.3 1987 73.7 42.9 1975 63.2 31.9 1988 76.0 42.5 1976 67.5 41.1 1989 76.5 56.1 1977 70.0 41.6 1990 77.7 52.3 1978 69.4 43.0 1991 71.4 42.7 1980 70.3 39.1 1993 75.4 51.5 1982 76.9 48.4 1994 78.3 50.7 1983 76.2 45.0 1996 75.5 50.3 1984 74.5 43.5
Step by Step Solution
3.35 Rating (158 Votes )
There are 3 Steps involved in it

Get step-by-step solutions from verified subject matter experts