

Determine and interpret the interquartile range of the collision claim data from Example 3. Approach Use the
Question:
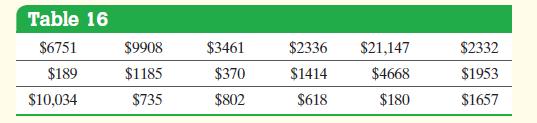
Determine and interpret the interquartile range of the collision claim data from Example 3.
Approach Use the quartiles found by hand in Example 3. The interquartile range, IQR, is found by computing the difference between the third and first quartiles. It represents the range of the middle 50% of the observations.
Data from Example 3
The Highway Loss Data Institute routinely collects data on collision coverage claims. Collision coverage insures against physical damage to an insured individual’s vehicle. The data in Table 16 represent a random sample of 18 collision coverage claims based on data obtained from the Highway Loss Data Institute. Find and interpret the first, second, and third quartiles for collision coverage claims.
Step by Step Answer:


Statistics Informed Decisions Using Data
ISBN: 9781292157115
5th Global Edition
Authors: Michael Sullivan
