

Question: Graph the discrete probability distribution given in Table 1 from Example 2. Approach In the graph of a discrete probability distribution, the horizontal axis represents
Graph the discrete probability distribution given in Table 1 from Example 2.
Approach In the graph of a discrete probability distribution, the horizontal axis represents the values of the discrete random variable and the vertical axis represents the corresponding probability of the discrete random variable. Draw the graph using vertical lines above each value of the random variable to a height that is the probability of the random variable.
Data from Example 2
Suppose we ask a basketball player to shoot three free throws. Let the random variable X represent the number of shots made, so x = 0, 1, 2, or 3. Table 1 shows a probability distribution for the random variable X.
We denote probabilities using the notation P(x), where x is a specific value of the random variable. We read P(x) as “the probability that the random variable X equals x.” For example, P(3) = 0.51 is read “the probability that the random variable X equals 3 is 0.51.”
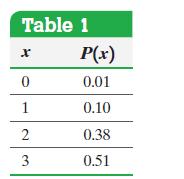
Table 1 x P(x) 0 0.01 1 0.10 2 0.38 3 0.51
Step by Step Solution
3.49 Rating (156 Votes )
There are 3 Steps involved in it
Figure 2 sh... View full answer

Get step-by-step solutions from verified subject matter experts